Motivation
Variability in astronomical sources can manifest in multiple forms, intrinsic or extrinsic. Intrinsic variability may be caused by changes in the physical conditions, such as those observed in Cepheid Variables or stellar flares, or it may be accretion-induced, as seen in cataclysmic variables and Active Galactic Nuclei (AGN). Extrinsic variability, on the other hand, results from geometrical factors.
AGN, in particular, are known to exhibit variability of about 10% across various timescales, ranging from less than an hour to several years. This variability is not uniform across all AGN, presenting a wide spectrum of stochastic behavior. In response to the complex nature of the processes governing these variations, and the nonlinearity observed in quasar light curves, our package—Quasar harmonic eXplorer (QhX)—has been developed to include a method for detecting periodic variability through the cross-correlation of wavelet transforms of quasar light curves in pairs of bands.
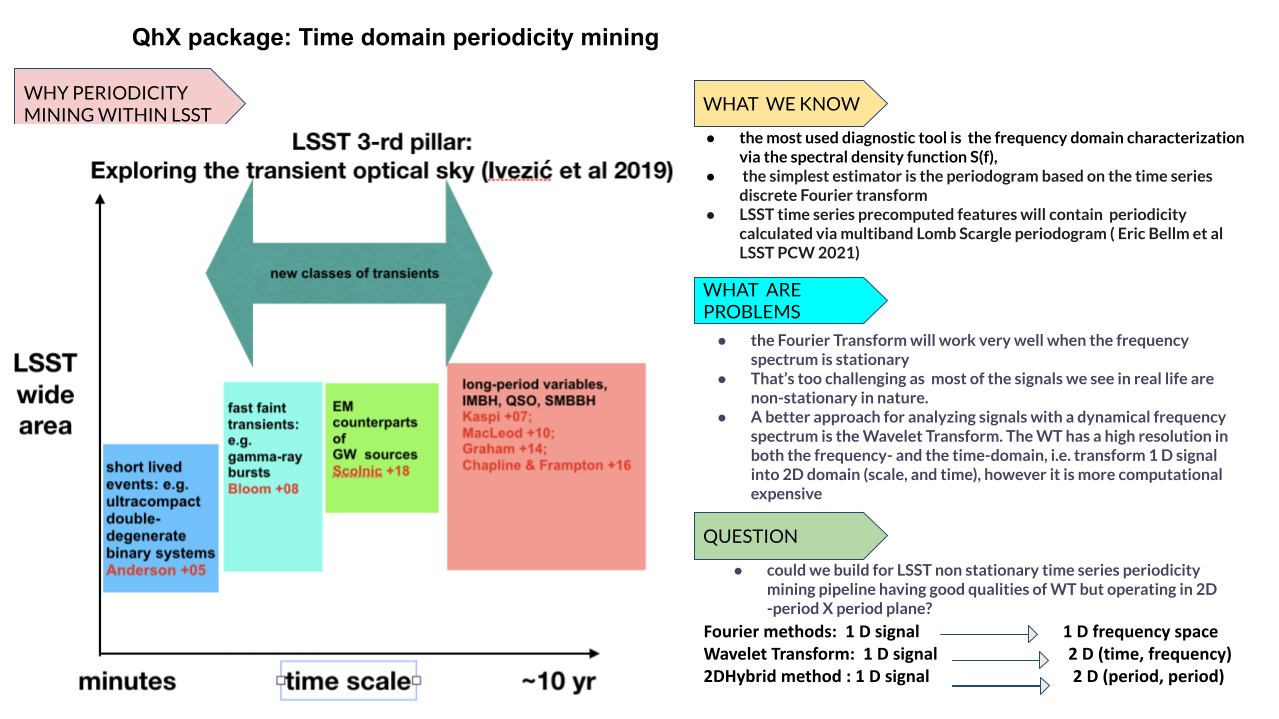
Theoretical background
Quasar emission often exhibits red noise, which manifests as self-similar patterns over varying time scales. This characteristic makes it difficult to identify clear signals of quasi-periodic oscillations (QPO) or binary systems due to the Fourier uncertainty principle. To address these challenges, we have developed a pipeline for nonlinear periodicity detection.
Traditional periodograms transform time-domain signals into the frequency domain. While effective for stationary frequency spectra, this method falls short when handling non-stationary signals, which are common in quasar light curves. The cornerstone of our approach is the 2DHybrid method. Distinct from traditional Fourier methods, the 2DHybrid technique auto or cross-correlates wavelet matrices from one or two signals, transforming them into a two-dimensional domain of period correlations. We specifically use the Weighted Wavelet Z-transform (WWZ), which is highly effective in uncovering periodicities within quasar light curves. The cross-correlation of wavelet matrices of signals, \(x(t)\) and \(y(t)\), is defined by:
where \(W_x(a, b)\) and \(W_y(a, b)\) are the wavelet transforms of the signals at scale \(a\) and translation \(b\). \(W_y^*(a, b)\) denotes the complex conjugate of \(W_y(a, b)\). This operation introduces nonlinearity by integrating over the translation parameter \(b\), allowing for the detection of complex, multicomponent signals.
Additionally, the Gabor limit can be assessed using the WWZ transform’s frequency (\(f\)) and time (\(\tau\)) data, ensuring the reliability of detected periodicities:
where \(\Delta f_i = f_{i+1} - f_i\) and \(\Delta f = \frac{1}{m}\sum_{i=1}^{m-1} \Delta f_i\), and similarly for \(\Delta \tau\).
Below is the image that demonstrates the workflow of the 2DHybrid method from data input to output:
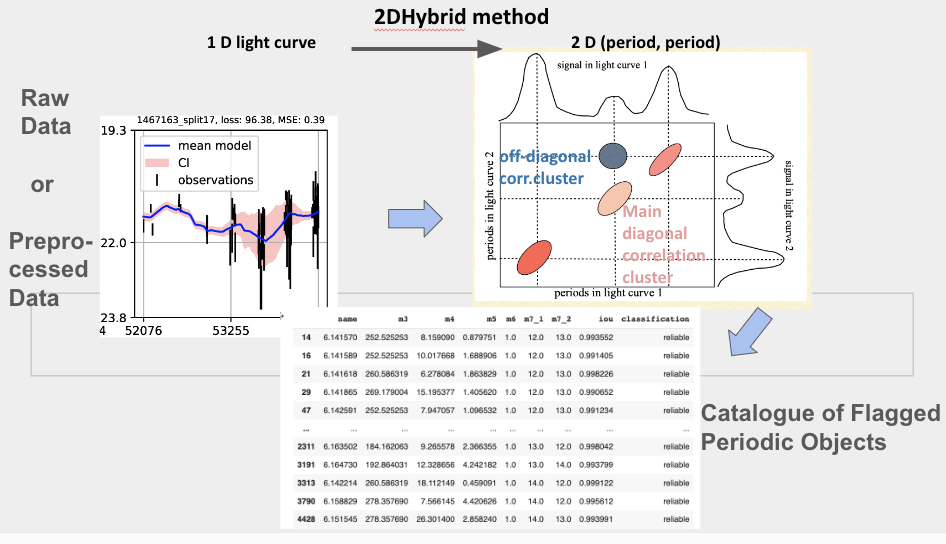
Figure Description: The image visually outlines the 2DHybrid method used in our pipeline, from the raw or preprocessed data to the final catalog of flagged periodic objects:
Raw Data or Preprocessed Data: Displays a plot of a 1D light curve, highlighting observed data, mean model, and confidence intervals.
2DHybrid Method (Period-Period Domain): Shows the transformation from 1D light curves to a 2D period-period correlation plane. It details main diagonal and off-diagonal correlation clusters, which represent potential periodic components detected by the method.
Catalog of Flagged Periodic Objects: Depicts the output as a catalog of detected periodic objects, listing detected periods with parameters such as name, period values, and reliability classifications.
Key Features
Our pipeline transforms input data into a time-period plane using wavelet transforms, then (auto)correlates the resulting wavelet matrices to generate a correlation density in the period-period domain. This allows for the identification of distinct periodic components in quasar light curves, which manifest as “islands” in the correlation map. The numerical values are obtained by integrating correlation maps along one of dimensions.
Intersection over Union (IoU) Metric: We introduce the IoU metric to evaluate the overlap of detected periods across multiple bands. Alongside traditional statistical measures like significance and error margins, the IoU metric helps to quantify the confidence of each detection. Each detected period is visualized within an “IoU ball,” where the radius reflects relative error, providing a clear and intuitive representation of the detected signals.
Numerical and dynamic visual catalogs: The pipeline generates comprehensive results files in both CSV and visual formats. Using HoloViews, we offer dynamic visualizations of periodicity candidates, stratified across bands based on statistical vetting, making it easier to assess and explore the results.
Performance and Scalability
We tested Quasar harmonic eXplorer (QhX) across the LSST AGN Data Challenge and GAIA DR3. These tests were conducted on platforms ranging from the the in-house high-performance computing (HPC) stations to ATOS AI Platform with four Nvidia servers and 120k cores,and personal devices, ensuring cross-platform compatibility.
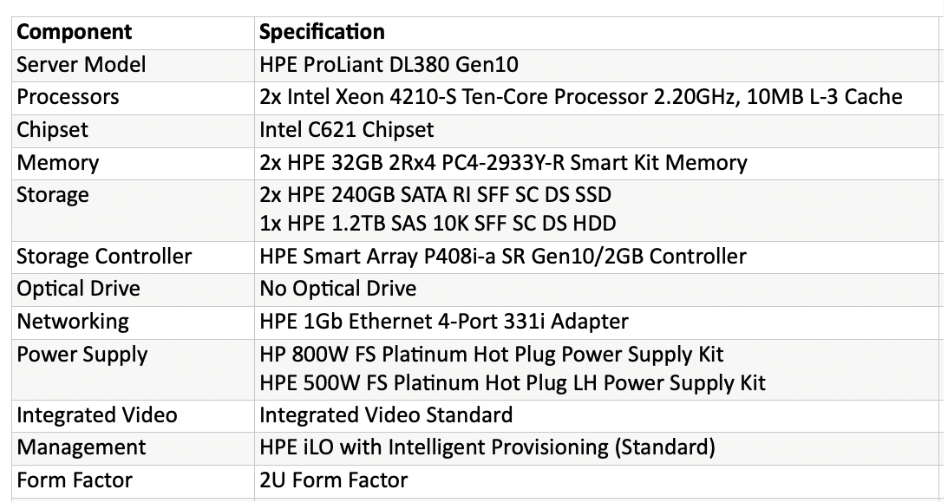
Figure: In-House HPC System Specifications. Detailed here are the specifications of our in-house HPC system, the HPE ProLiant DL380 Gen10 server, which represents a smaller-scale, yet highly capable, computing resource. Equipped with dual Intel Xeon processors and 64GB of memory, this system supports a variety of computational tasks, ideal for preliminary testing and smaller data sets before scaling up to larger platforms.
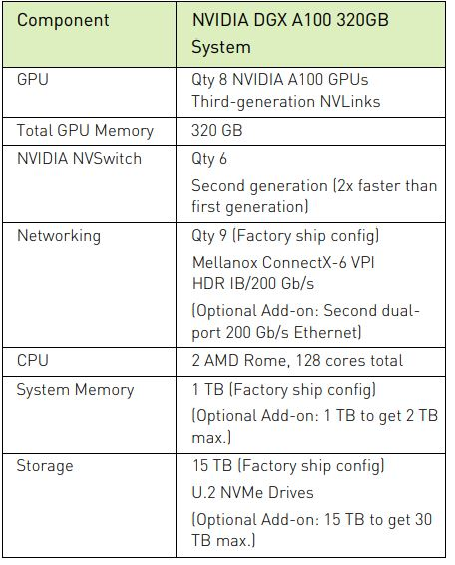
Figure: ATOS AI Platform Specifications. Detailed here are the specifications for the NVIDIA DGX A100 320GB system utilized on the ATOS AI Platform, where our pipeline has been extensively tested. This high-performance setup includes eight NVIDIA A100 GPUs and 1TB of system memory, providing substantial computational power for large-scale machine learning and deep learning workloads.
QhX Project History
Foundation of the Method and Code Functions
Lead: Andjelka Kovacevic, in-kind lead
Publications: - Kovacevic et al. 2018 - Kovacevic et al. 2019 - Kovacevic, Popovic, Ilic 2020
Initial Modularization
Contributor: Viktor Radovic, former in-kind postdoc
Modules Enhancement, Expansion, Packaging, and Testing
Lead: Andjelka Kovacevic
Publications: - Kovacevic et al. 2022 - Kovacevic 2024 (accepted) - `Kovacevic et al. (in prep)
Parallelization
Contributor: Momcilo Tosic, AI guest student under the mentorship of Andjelka Kovacevic
Publication: - Kovacevic, Tosic, Ilic et al. (in prep)
Testing
Contributors: - Momcilo Tosic - Vuk Ostojic - Andjelka Kovacevic within COST Action MW GAIA STSM 2023
QhX Package Overview
The QhX package is structured into several modules, each with a specific role as indicated in the architecture diagram below.
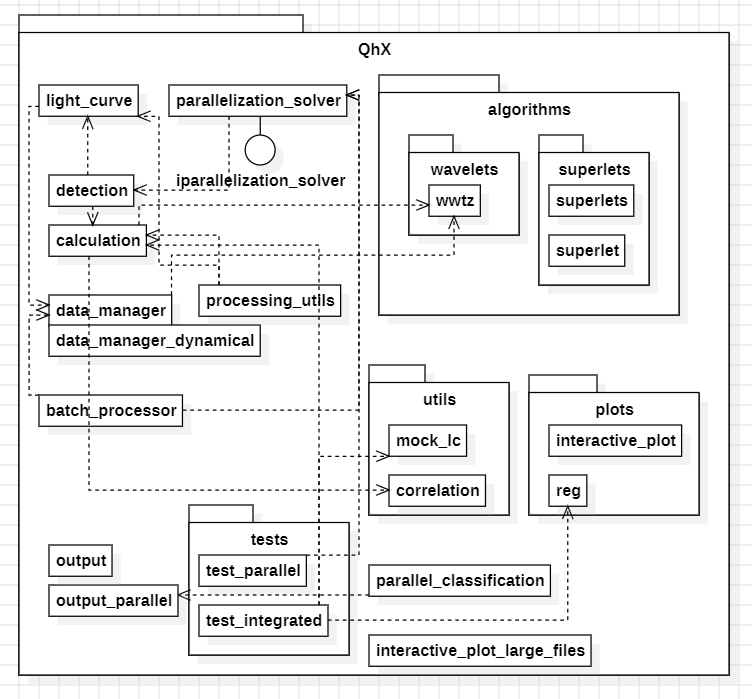
We adopt a modular approach to ensure optimal organization, scalability, and maintainability. By segmenting functionality into distinct modules, we prioritize the separation of concerns, allowing each part of the package to focus on specific aspects of data processing or analysis. This modularity not only facilitates parallel development—enabling different teams to work on separate components simultaneously—but also enhances the scalability of our system, as individual modules can be optimized or redeveloped independently to improve performance and resource management.
Furthermore, the modular design enhances the reusability of our code. Modules crafted for particular tasks can be easily integrated across different parts of the project or reused in future projects, provided they have well-defined interfaces. This approach simplifies testing and maintenance, as each module can be tested and debugged in isolation, reducing the complexity involved in managing a large codebase. Additionally, our modular architecture offers flexibility in integration, making it straightforward to incorporate various components or third-party modules, ensuring they interact seamlessly through established interfaces.
Main Modules
Algorithms Module The Algorithms module provides two primary strategies for time-series analysis:
waveletsandsuperlets. -wavelets: Contains functions for performing wavelet transformations and analyzing time-domain data. -superlets: Extends the wavelet approach for higher frequency resolution, with submodulessuperletandsuperletsfor customized configurations.Utilities Module The
utilsmodule offers essential utility functions, including: -mock_lc: Simulates red noise light curves for testing purposes. -correlation: Computes statistical correlations on matrices of wavelet coefficients, aiding in the identification of periodicities.Plots Module The
plotsmodule is designed for visualizing data, with components for: -interactive_plot: Enables interactive exploration of data, particularly useful for examining light curves in detail. -reg: A simpler plotting tool for static visualization of mock light curves and preliminary data checks.
Core Components
Light Curve Handling The
light_curvemodule processes and outputs light curves, with optional inclusion of magnitude errors for specific IDs. - Identifies and removes outliers using a Z-score threshold or Median Absolute Deviation (MAD). - Allows optional inclusion of flux measurement errors to enhance outlier detection accuracy.Parallelization Components This package supports high-performance computing through
parallelization_solverandiparallelization_solver: -parallelization_solver: Executes parallel computations on structured data suited for high-performance environments. -iparallelization_solver: Performs parallel processing on more generalized data inputs, providing flexibility for various dataset structures.Detection and Calculation These modules, along with
data_manageranddata_manager_dynamical, form the core processing capabilities of QhX. -Calculation: Estimates period errors using the Full Width at Half Maximum (FWHM) method and applies a 2D Hybrid approach for correlation analysis on wavelet-transformed light curves. -Detection: Identifies common periods across different bands, considering periods consistent within a 10% tolerance across bands. This module compiles period values, errors, and significance. - Significance is assessed following the methodology of Johnson et al. 2018 by simulating red noise light curves.Batch Processing The
batch_processorandmerge_batch_csvmodules facilitate batch processing for high-performance computing (HPC) environments: -batch_processor: Manages data processing in batch mode for efficiency on large datasets. -merge_batch_csv: Aggregates output files from batch processes into a single CSV file for easier post-processing and analysis.
Output Modules
The output and output_parallel modules handle the final classification and output generation:
- output: Serializes and classifies detected periods based on Intersection over Union (IoU) metrics. Each detected period in band pairs is classified as ‘reliable’, ‘medium reliable’, ‘poor’, or ‘NAN’ based on the period’s significance, error bounds, and IoU of error circles.
- output_parallel: Aggregates and classifies results from HPC batch outputs, streamlining data processing for large-scale datasets.
New Dynamic Module: QhX_dynamical
QhX_dynamical (QhX Version 0.2.0) introduces capabilities for handling datasets with dynamic filter configurations. - Supports both dynamic and fixed modes, making it versatile for datasets with or without variable filters. - Includes
ParallelSolverfor efficient parallel processing of large datasets and an advanced seeding mechanism to ensure reproducibility. - For consistent filter configurations, users can select the ‘fixed’ mode, making all functionalities fromQhX(Version 0.1.1) accessible.
Usage Recommendations
Use QhX (0.1.1) for datasets with consistent filter setups across all observations.
Choose QhX_dynamical for dynamic filter configurations or if you need flexibility in switching between fixed and dynamic modes.
Both versions are open-source and licensed under the MIT License, ensuring accessibility and modifiability.
—